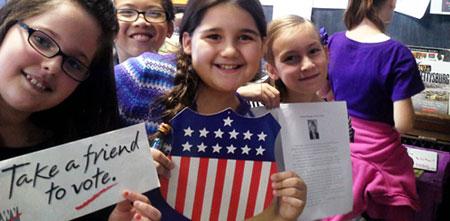
2024 Mock Election
What is it?
The National Student Mock Election is a program designed to teach students about the power of voting. Massachusetts schools can participate with the Kennedy Library and receive curriculum packets featuring candidates’ biographies, their positions on the issues, and classroom activities.
How does my school get involved?
Massachusetts educators can register their schools for the National Student Mock Election by signing up with this form. For questions, email mock.election@nara.gov.
The John F. Kennedy Presidential Library and Museum is the state coordinator for the National Student Mock Election for Massachusetts. This voter education program actively engages students in grades K-12 in state and national campaigns, and emphasizes the importance of voting and the power of their ballots.
2022 Mock Election
The results for Massachusetts:
| Maura Healey | 3,883 | 55.4% |
| Geoff Diehl | 2,858 | 40.8% |
| Kevin Reed | 185 | 2.6% |
| Write-ins | 74 | 1.1% |
See how Massachusetts students voted in past elections:
2020 Mock Election
| Joe Biden | 5,600 | 70.7% |
| Donald J Trump | 2,010 | 25.4% |
| Howie Hawkins | 98 | 1.2% |
| Jo Jorgensen | 73 | 0.9% |
| Write-Ins | 139 | 1.8% |
2018 Gubernatorial Election
| Charlie Baker (R) | 63.9% |
| Jay Gonzalez (D) | 31.5% |
| Write-In Candidates | 1.8% |
View the 2018 Ballot Question results.
2016 Presidential Election
| Hillary Rodham Clinton (D) | 24,634 | 50.5% |
| Donald Trump (R) | 15,827 | 32.4% |
| Gary Johnson (L) | 3,495 | 7.2% |
| Jill Stein (G-R) | 2,267 | 4.6% |
| Write Ins | 2,569 | 5.3% |
| 48,792 total votes | ||
View the 2016 Ballot Question results.
Visit our photo gallery to see how Massachusetts students prepared and celebrated Mock Election Day in 2016.
2014 Gubernatorial Election
| Charlie Baker (R) | 5,544 | 51.0% |
| Martha Coakley (D) | 4,735 | 43.5% |
| Write Ins* | 601 | 5.5% |
| 10,880 total votes |
* This total includes votes for the three 3rd party candidates, Evan Falchuk, Scott Lively, and Jeff McCormick, and other write-in candidates.
View 2010 Ballot Question results.
2012 Presidential Election
| Barack Obama (D) | 45,939 | 68.44% |
| Mitt Romney (R) | 18,983 | 28.28% |
| Gary Johnson (L) | 890 | 1.32% |
| Jill Stein (G-R) | 1,314 | 1.95% |
| Write Ins | 62 | 0.01% |
| 67,118 total votes |
View results for all 2012 races.
Visit our photo gallery to see how Massachusetts students prepared and celebrated Mock Election Day in 2012.
2010 Gubernatorial Election
| Deval Patrick (D) | 6,289 |
| Charlie Baker (R) | 5,645 |
| Tim Cahill (I) | 2,654 |
| Jill Stein (G-R) | 1,382 |
| Write Ins | 3 |
2008 Presidential Election
| Barack Obama (D) | 59,974 |
| John McCain (R) | 26,307 |
| Ralph Nader (I) | 1,606 |
| Write Ins | 1,052 |
| Cynthia McKinney (G) | 565 |
| Bob Barr (L) | 362 |
| Chuck Baldwin (C) | 307 |
2006 Gubernatorial Election
| Deval Patrick (D) | 8,902 |
| Kerry Healey (R) | 5,455 |
| Christy Mihos (I) | 1,781 |
| Grace Ross (G-R) | 1,546 |
| Write Ins | 0 |
2004 Presidential Election
| John Kerry (D) | 40,929 |
| George W. Bush (R) | 26,346 |
| Ralph Nader (I) | 2,850 |
| Write Ins | 223 |
| David Cobb (G) | 195 |
| Michael Badnarik (L) | 127 |
| Walt Brown (S) | 84 |
| Michael Peroutka (C) | 2 |
Please note that the election results should not and cannot be used as an accurate prediction, or as the basis for an accurate prediction of real election results.
